
Ask any Chief Marketing Officer or tech founder where their biggest media budget leak occurs in customer acquisition campaigns, and the answer is rarely “poor ad copy” or “imprecise keyword targeting.” The most expensive point of failure in modern marketing occurs at the final step of the funnel: the landing page.
Every month, tens of thousands of dollars are deployed into Google Ads, Meta Ads, and LinkedIn campaigns to drive high-intent prospective buyers to click. Yet upon arrival, the vast majority of companies route this premium paid traffic directly to their corporate homepage or an unfocused blog article packed with navigation menus, secondary links, and distractions.
The business consequences are immediate and severe:
- Bounce rates spike to 70%+: Prospective clients click for a specific solution, only to be confronted with a generic corporate overview.
- Conversion rates stagnate at 1.0% – 1.5%: Only one out of every hundred paid visitors actually completes an inquiry.
- Customer Acquisition Cost (CAC) triples: Marketing teams pour more capital into media spend, yet bottom-line revenue fails to scale proportionally.
With global digital advertising costs climbing 18% to 25% year-over-year, landing page conversion optimization is no longer just a marketing tactic. It is a critical engineering and economic discipline that dictates the unit economics and profitability of the entire business.
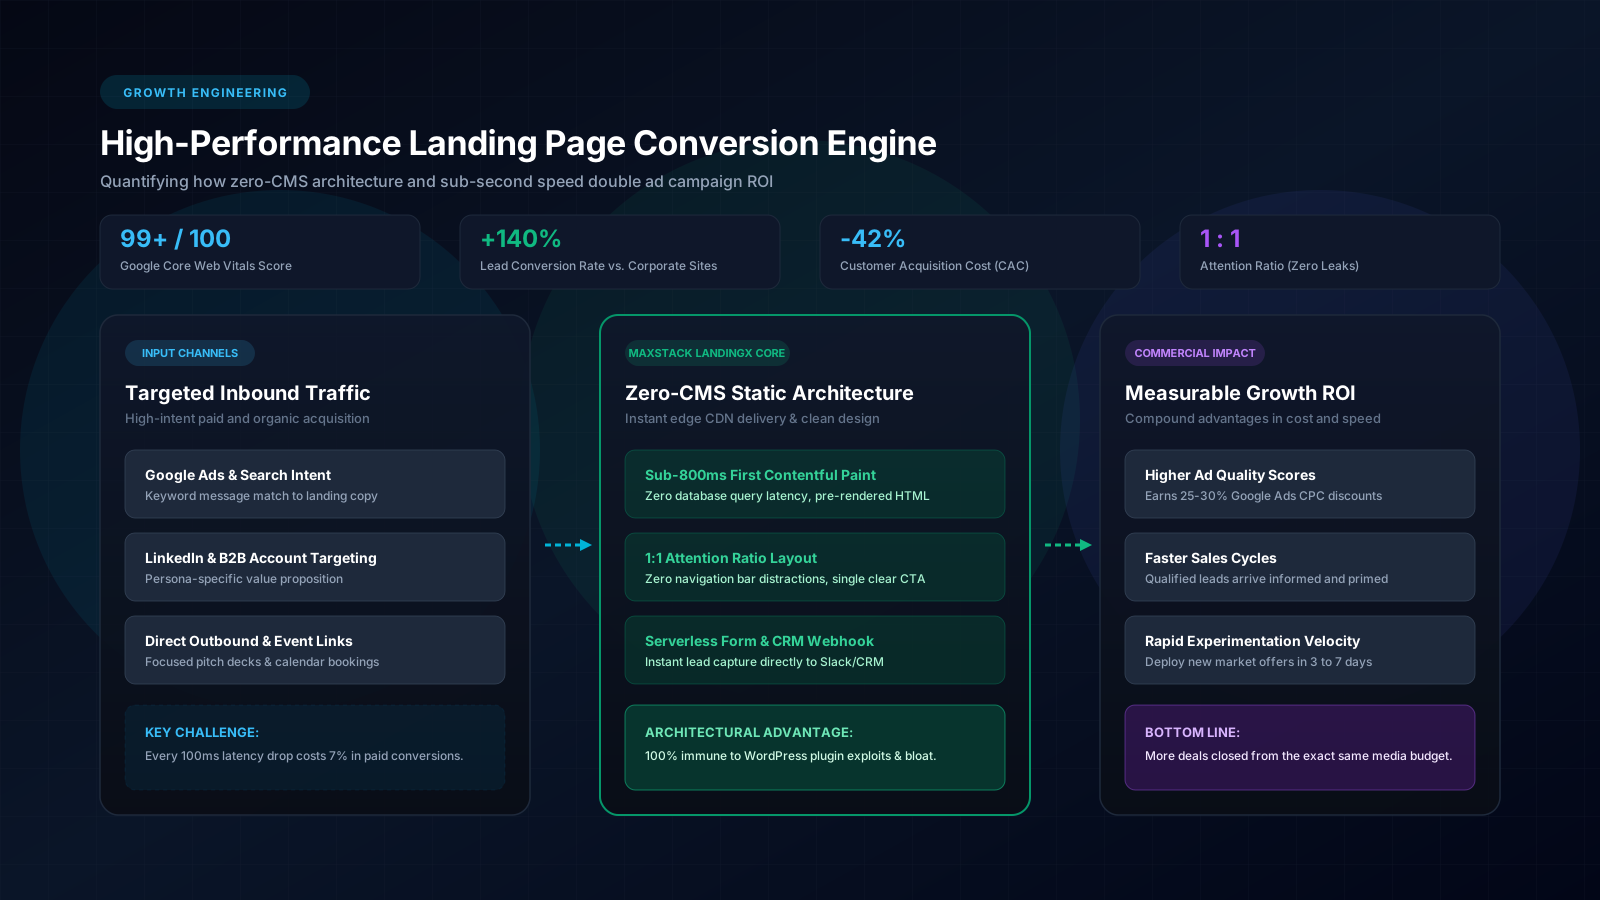 Figure 1: The closed-loop conversion engine — High-intent inbound traffic channeled through instant edge delivery, yielding direct financial reductions in customer acquisition costs.
1. Funnel Economics: Why Routing Paid Traffic to Corporate Homepages Destroys Capital
To understand why traditional multi-purpose websites bleed advertising capital, consider the concept of Attention Ratio, first formulated by conversion specialist Oli Gardner:
Attention Ratio = [Number of Clickable Links on the Page] / [Number of Desired Conversion Goals]On a typical corporate homepage:
- Header navigation contains 6 to 8 dropdown menus, each with 4 to 5 sub-pages.
- Search bars, language pickers, and social media icons (LinkedIn, X, YouTube) pull focus away.
- Footer sections feature dozens of links: careers, press releases, company history, blog archives, and legal notices.
- The total clickable elements frequently reach 30 to 50 distinct destinations.
Meanwhile, the sole objective of your paid campaign is simple: Get the qualified prospect to book a product demo (exactly 1 conversion goal).
The resulting Attention Ratio of a standard homepage is 50 : 1. You are effectively providing prospective customers with 49 escape hatches to wander off, read about your office culture, click your social profiles, and abandon the session before they ever scroll to the contact form.
By contrast, a purpose-built landing page maintains an Attention Ratio of exactly 1 : 1. Extraneous navigation bars are completely removed. Every headline, visual diagram, ROI calculator, and customer case study functions as a singular narrative vector pointing toward the primary conversion action.
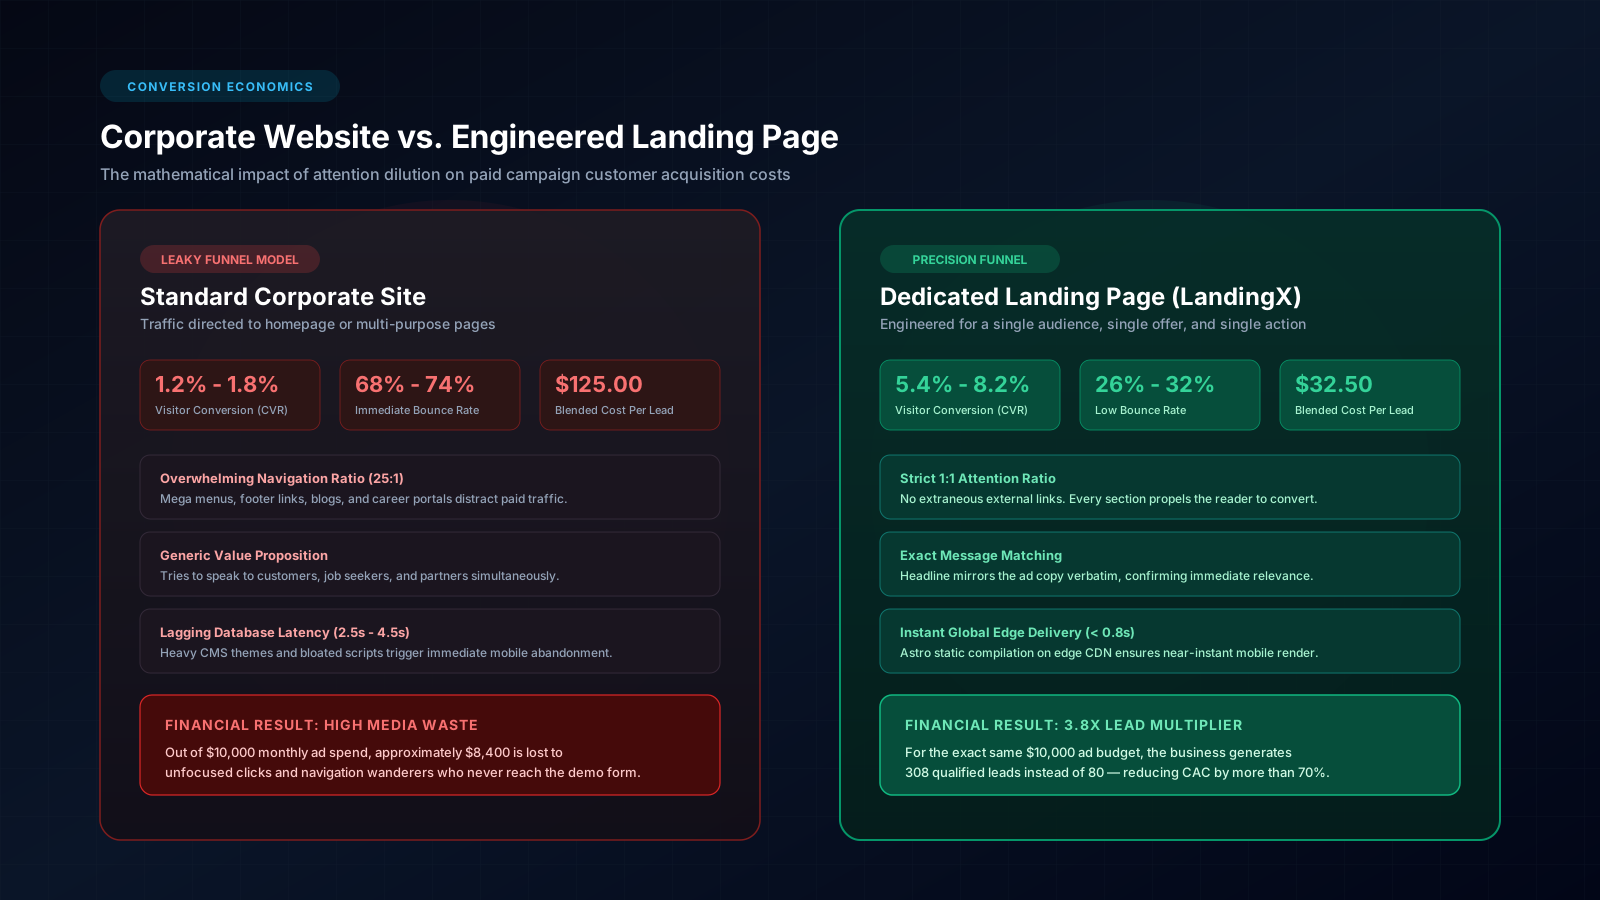 Figure 2: Financial comparison across identical $10,000 ad spend — Dedicated landing pages slash cost per qualified lead from $125 down to $32.50 by eliminating attention leaks.
Here is how the unit economics compare across the two paradigms on identical target audiences:
| Operational Dimension | Generic Corporate Website | Engineered Landing Page (LandingX) | Commercial Impact |
|---|---|---|---|
| Primary Purpose | Brand representation & general info | Persuading visitor to take one specific action | Laser-focused messaging |
| Attention Ratio | 25:1 to 50:1 (Heavy dilution) | 1:1 (Single conversion target) | Eliminates traffic leakage |
| Message Matching | Generic catch-all copy | Exact 100% alignment with ad keywords | Reduces cognitive friction |
| Conversion Rate (CVR) | 1.0% – 1.8% | 5.0% – 8.5% | 3x to 5x increase in qualified leads |
| Deployment Speed | 2 – 4 months | 3 – 7 days | Seizes market opportunities instantly |
| Customer Acquisition Cost | High (Diluted by wasted clicks) | 50% to 70% Lower | Expands net profit margins |
2. The Science of Speed: How Core Web Vitals Directly Drive Ad Quality Scores and CPC
Many marketing leaders assume that conversion optimization is purely an exercise in copywriting and aesthetic UI design. However, in modern digital commerce, page load velocity is the primary gateway that determines whether a prospect ever reads your value proposition in the first place.
Extensive research across mobile commerce by Google and Deloitte Digital demonstrates:
- As page load time increases from 1 second to 3 seconds, the probability of an immediate bounce rises by 32%.
- At the 5-second mark, the bounce rate escalates by 90%.
- For every 100-millisecond reduction in load time, enterprise B2B and e-commerce platforms observe an average 8.4% improvement in completed conversions.
Yet the financial penalty of slow infrastructure goes far beyond lost visitors. It directly increases what you pay per click via ad network auction algorithms.
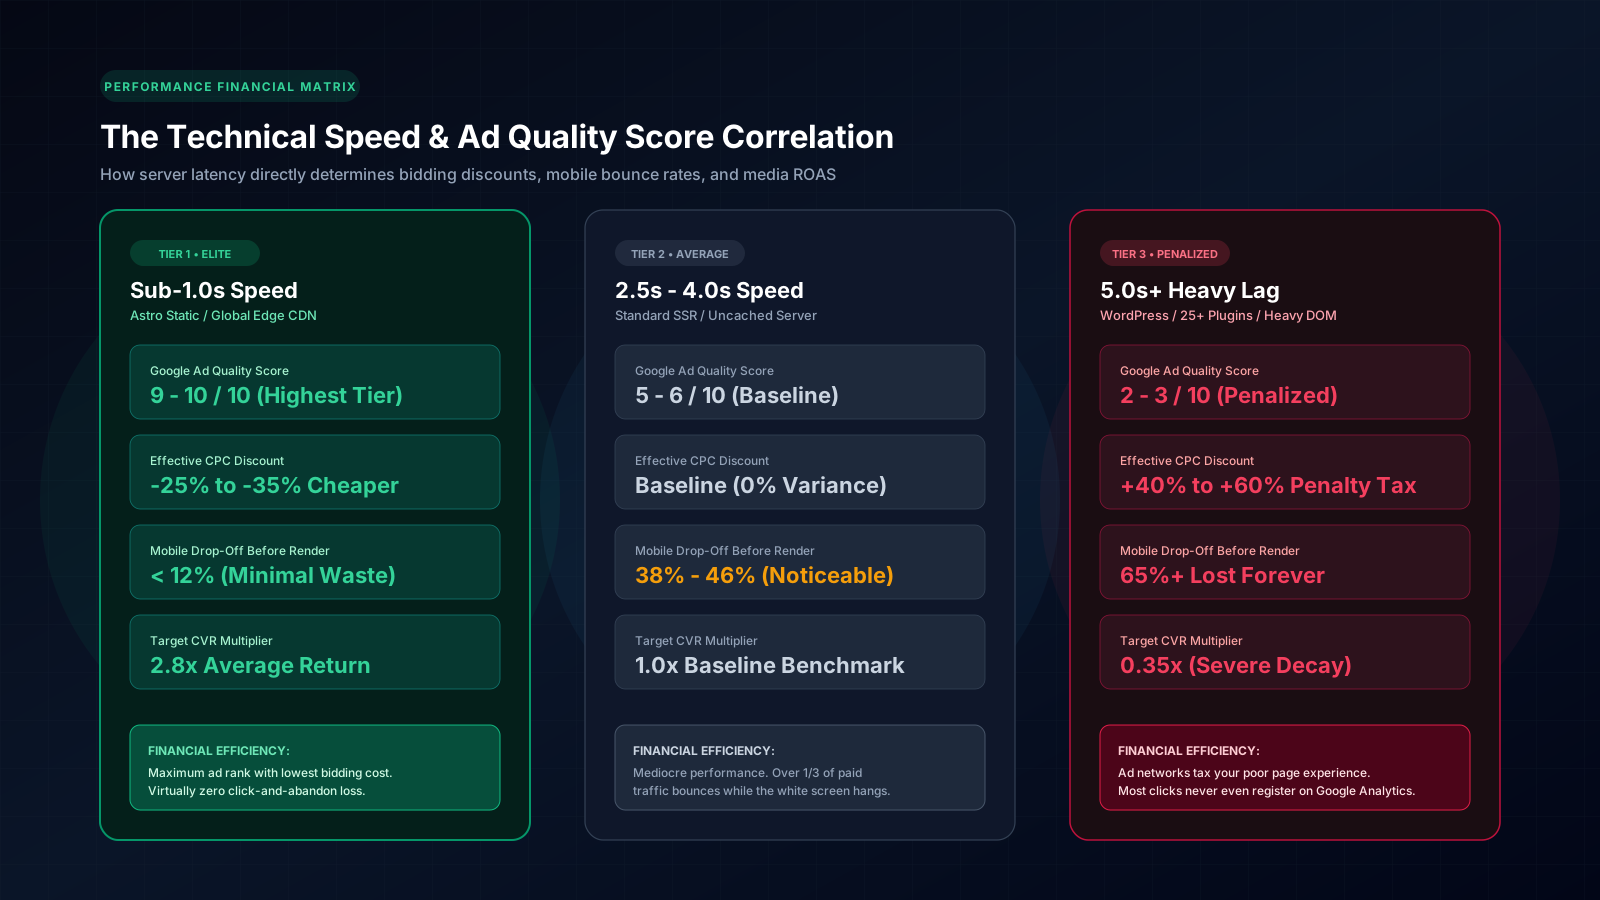 Figure 3: Financial efficiency matrix by speed tier — Google Ads penalizes pages loading over 5 seconds with a 50% bidding penalty, while granting up to 35% discounts to sub-second pages.
Google’s Quality Score Formula: The Hidden Auction Tax
In Google’s ad ranking algorithm (Ad Rank), your position and actual cost-per-click are calculated using:
Ad Rank = CPC Bid × Quality ScoreThe Quality Score (graded 1 to 10) is determined by three factors:
- Expected Click-Through Rate (CTR).
- Ad Relevance to the search term.
- Landing Page Experience.
Technical Core Web Vitals (specifically LCP – Largest Contentful Paint, INP – Interaction to Next Paint, and CLS – Cumulative Layout Shift) serve as the underlying benchmark:
- Sub-1.0s LCP Performance: Google rates your landing page experience as “Above Average,” lifting your overall Quality Score to 9/10 or 10/10. As a result, you secure top ad rank while receiving a 25% to 35% effective discount on every single click compared to competitors.
- Bloated CMS Performance (4.5s – 6.0s LCP): Quality Score plunges to 2/10 or 3/10. To maintain ad placement, Google enforces an effective 40% to 60% penalty tax, forcing you to overpay for traffic while more than half of your clicks bounce before your product images even render.
In short: A sluggish landing page is an ongoing stealth tax that systematically drains your advertising budget.
3. Why Zero-CMS Static Architecture Outperforms WordPress and Visual Page Builders
For years, marketing departments have defaulted to installing page builder plugins (Elementor, Divi) on WordPress or subscribing to visual drag-and-drop SaaS platforms (Unbounce, Webflow, Instapage).
While convenient for non-technical users, these platforms introduce severe architectural bottlenecks that handicap business performance:
1. The Code Bloat Penalty
Visual builders generate nested DOM structures and bundle massive libraries of unused CSS and JavaScript to support arbitrary drag-and-drop operations. A page with minimal text can easily weigh 5MB to 8MB, causing mobile Google PageSpeed scores to languish below 45/100.
2. The Maintenance and Security Overhead
WordPress landing pages require continuous patching of the core system, themes, and third-party plugins. During major ad campaigns, unexpected plugin conflicts or database concurrency bottlenecks can cause server outages, throwing thousands of dollars in active ad spend directly down the drain.
3. The MaxStack Approach: Static Pre-Rendering (LandingX)
At MaxStack, our LandingX service is built around an uncompromising engineering standard designed to maximize commercial ROI:
- Static Pre-Compilation: Built with Astro and Tailwind CSS, all HTML and CSS are pre-rendered at build time. There is no runtime database querying, no server-side PHP bottleneck, and zero unnecessary JavaScript execution.
- Global Edge Distribution: Deployed across worldwide Edge CDN nodes, pages load in under 800 milliseconds regardless of whether the prospect is browsing from London, Singapore, or New York.
- Virtually Zero Attack Surface: With no dynamic CMS backend or MySQL database exposed to the public web, security vulnerability maintenance drops to zero.
- Serverless Form Processing: Inbound leads submitted through forms are validated and routed via secure webhooks directly into your CRM (HubSpot, Salesforce, Odoo) or Slack channels in less than three seconds.
4. The 7-Component Blueprint for a High-Converting B2B Landing Page
To consistently drive commercial outcomes, MaxStack employs a battle-tested information architecture:
┌─────────────────────────────────────────────────────────────────┐
│ 1. HERO SECTION: Value Proposition + Fast Proof                │
│    (Headline matches ad copy, subhead, primary conversion CTA)  │
├─────────────────────────────────────────────────────────────────┤
│ 2. PAIN POINT QUANTIFICATION (The Cost of Inaction)             │
│    (Concrete operational and financial cost of status quo)      │
├─────────────────────────────────────────────────────────────────┤
│ 3. THE SOLUTION MECHANISM (How It Works)                        │
│    (Visual 3-step process or architecture blueprint)            │
├─────────────────────────────────────────────────────────────────┤
│ 4. VERIFIABLE SOCIAL PROOF & METRICS                            │
│    (Hard data: ROI percentage, revenue growth, real client logos)│
├─────────────────────────────────────────────────────────────────┤
│ 5. AUDIENCE QUALIFICATION & COMPARISON MATRIX                   │
│    (Defines ideal company profile, filters out unqualified leads)│
├─────────────────────────────────────────────────────────────────┤
│ 6. OBJECTION HANDLING & RISK REVERSAL (FAQ)                     │
│    (Addresses timelines, pricing transparency, and guarantees)  │
├─────────────────────────────────────────────────────────────────┤
│ 7. FINAL ACTION CATALYST (Streamlined Bottom Form)              │
│    (Minimalist input fields: Name, Work Email, Phone, Company)  │
└─────────────────────────────────────────────────────────────────┘- Exact Message Match Hero: The landing page headline must mirror the phrasing of your ad copy verbatim. Within the first three seconds, the visitor must confirm they arrived at the exact solution promised.
- Quantified Cost of Inaction: Rather than listing abstract features, illustrate the exact monthly cost and operational drag of delaying a solution.
- Visual Solution Architecture: B2B decision-makers demand clarity over marketing hype. Provide an explicit step-by-step roadmap demonstrating how implementation unfolds.
- Unfabricated Social Proof: Highlight verified performance figures, verifiable case studies, and testimonials from executive buyers.
- Audience Filtering: Explicitly state who the solution is designed for (e.g., companies with 50–500 employees) and who it is NOT for. This saves dozens of hours for your outbound sales team.
- Risk Reversal: Provide explicit guarantees regarding delivery timelines, performance SLAs, and support warranties.
- Frictionless Lead Capture: Every additional field on a lead form reduces completion rates by approximately 10%. Keep initial intake restricted to essentials: Name, Work Email, Phone, and Company Size.
5. Conclusion: Stop Letting Your Landing Page Be the Weakest Link
Paid advertising accomplishes only one goal: renting a few seconds of a prospective buyer’s attention.
Whether that expensive attention converts into sales qualified leads, booked demos, and compound revenue depends entirely on the technical and structural caliber of your landing page.
A landing page engineered for peak performance — scoring 99+ on Core Web Vitals, maintaining a 1:1 attention ratio, built on zero-CMS static architecture, and tuned for commercial urgency — is not merely marketing collateral. It is an automated, 24/7 revenue engine that multiplies the financial return on every single marketing dollar you deploy.
If your business is preparing a new product launch or seeking to dramatically cut advertising acquisition costs, explore our LandingX package or schedule an architectural consultation with our senior engineering team.

Comments & Discussion
0Your email address will not be published.
No comments yet. Be the first to share your perspective!